Work Manager
Resourcing and scheduling made easy
Project Overview
The Work Manager is a feature where users are able to manage work orders from various starting points. It was needed in order to make assigning and scheduling resources quicker and easier. <br><br>I was able to come up with a solution that was intuitive and immersive, successfully allowing users to view, assign, edit and take full control of work orders.
The Goal
Create a feature that was intuitive and immersive, successfully allowing users to view, assign, edit and take full control of work orders.
The Users
The users are supply chain managers and analysts who need quick access to critical data in order to make decisions.
The Solution
An all in one dashbaord that allows users to view, assign, edit and take full control of work orders.
Research & Discovery
Understanding the complex needs of enterprise users
The current version of On Key had dashboards for each resource type where the user would maintain each resource separately from one another. This meant that the user would go to a task dashboard and assign a staff member to the task without context of capacity or availability without having to open a separate screen.
In order to get a full sense and scope of work needed for this feature, I created research interviews with various key users about their current pain points.
Some of the key questions revolved around:
Understanding the users goals and needed
- Need for a signle source of truth for all resource
- A resource shoudl be be easy to update and maintain
- Indication of resource availability and capacity
- Progression of work and tasks
What where the pain points
- Resources are devided into multiple screens
- Having to open multiple screens to manage a single resource
- Lack of context of resource availability and capacity
What type of data is required to be displayed
- When is a resource available
- What is the capacity of a resource
- What is the progression of a resource
- What is the status of a resource
- The link between resources and tasks
- A summary of resource availability and capacity
What are the successful measurables
- Reduction in time to assign a resource
- Reduction in time to update a resource
- Increase in user satisfaction
- Increase in resource utilisation
Ideation
After gathering insights from our users, I conducted an ideation session with my team to combine user pain points with business objectives. The team was made up of Project Manager, 2 Designers, Front end Developer, Architect.
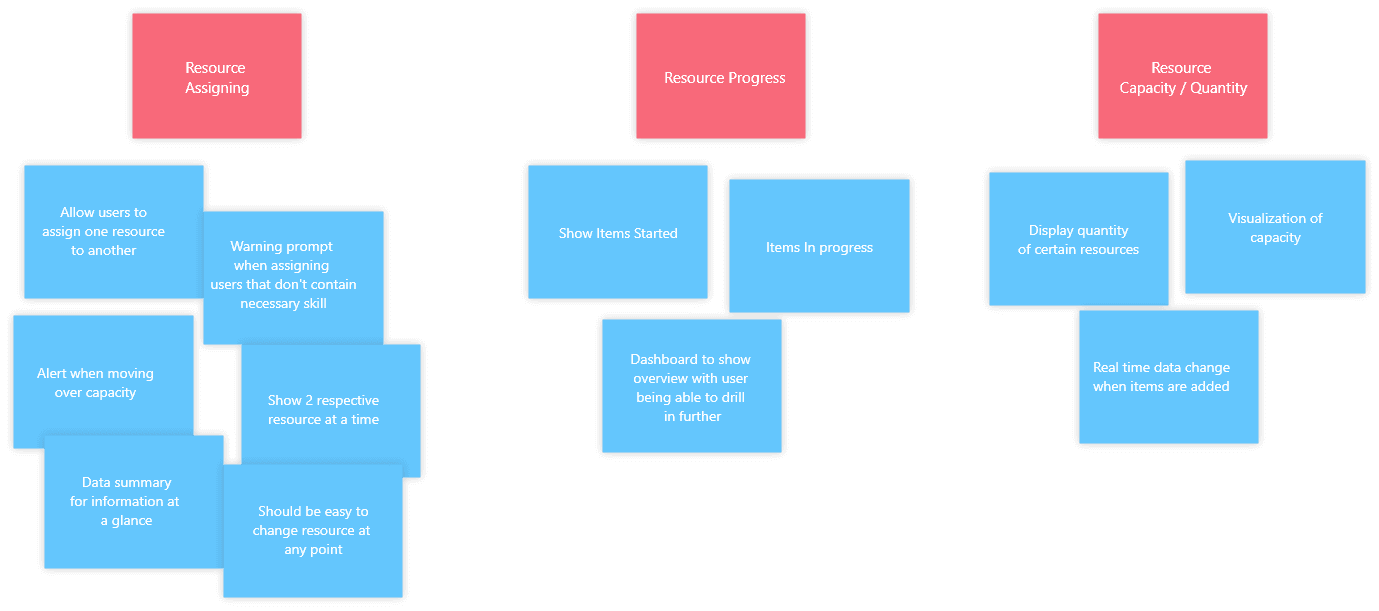
In order for the user to make the correct decision with regards to assigning items to a category, he or she would need to be aware of certain information. This was broken down into the following questions:
- What is the progress of tasks. Which tasks have been complete, which haven't been complete. Do tasks need to be assigned?
- What staff members are working of tasks and their capacity. Are they under or over worked.
- What spares or resources are required to complete a task.
- What trades are required to complete a task. Are those trades available?
Personas
I created a persona to help me understand the user's goals and needs. This was to help me create a user flow that would be easy to understand and follow. This also helped me to empathise with the our users and follow a user-centric design approach.
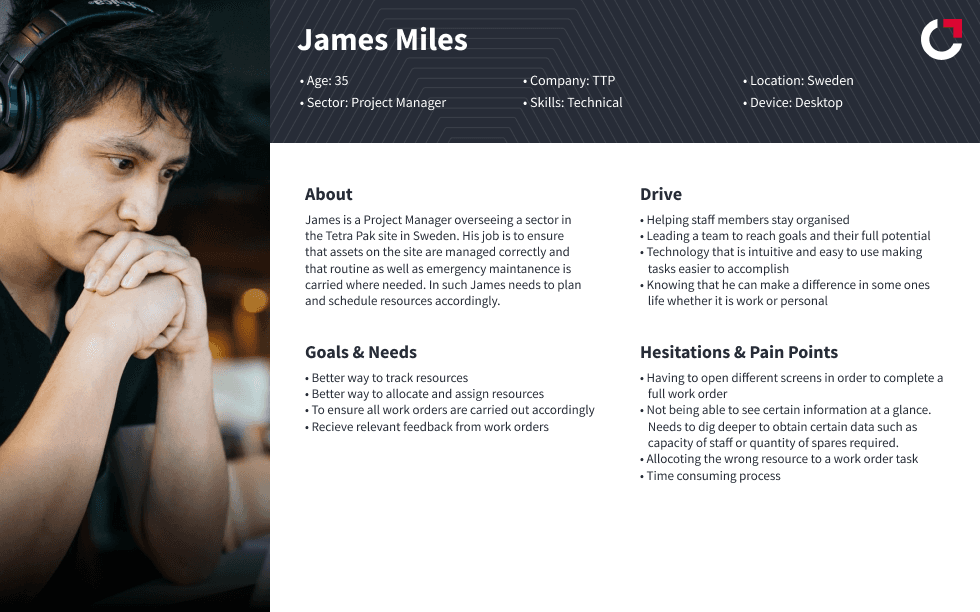

User Goals
John is a project manager and wants to get an overview of work orders assigned to his team. If a staff member is over capacity he would need to be able to dive in deeper and rectify if needed. If a staff member is under capacity, the need to allocate tasks to the member as well as view the implications of allocating tasks should be considered.
- John wants to get an overview of work orders assigned to his team
- John wants to be able to view the capacity of staff members
- John wants to be able to view the availability of staff members
- John wants to be able to assign resources to tasks
User Flow
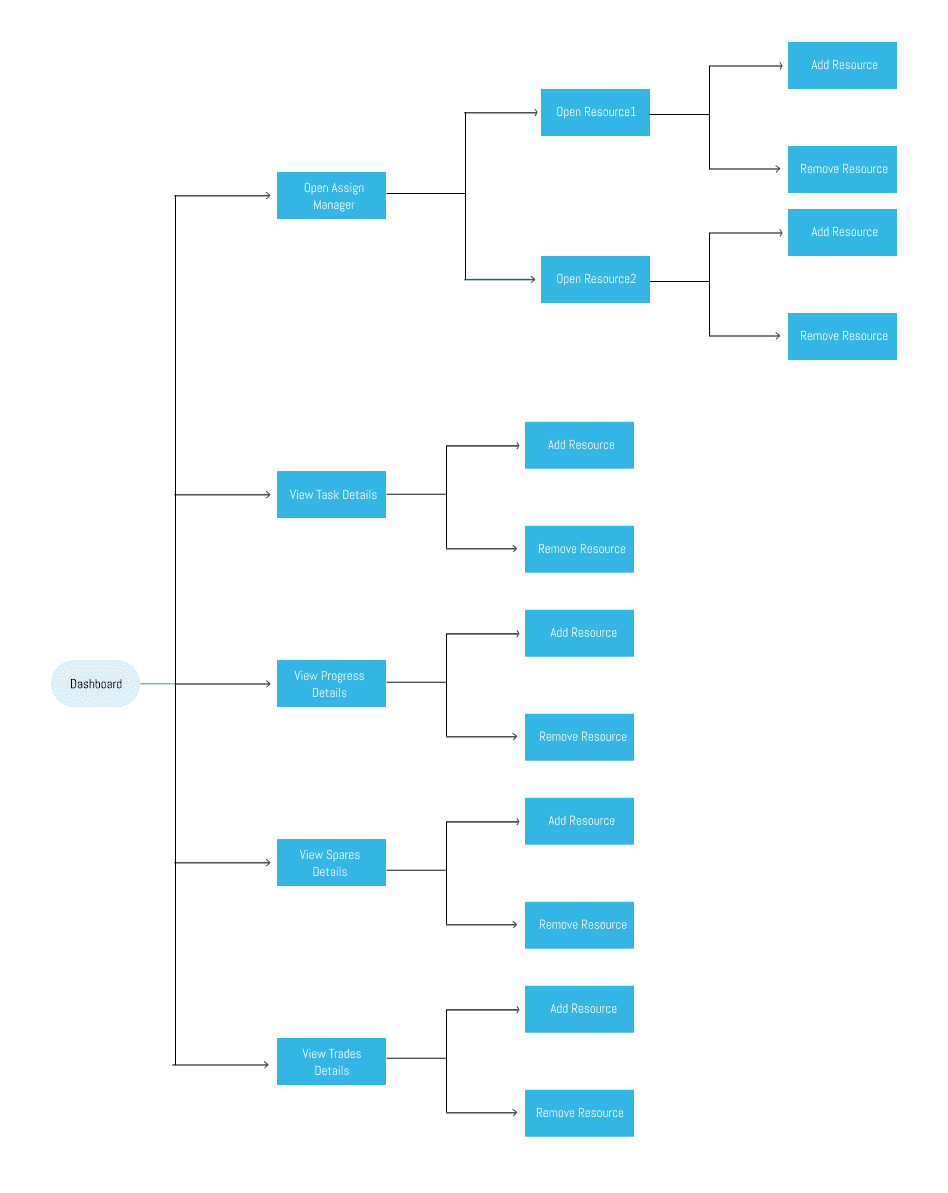
Designing the Solution
Deep dive into user behavior and needs
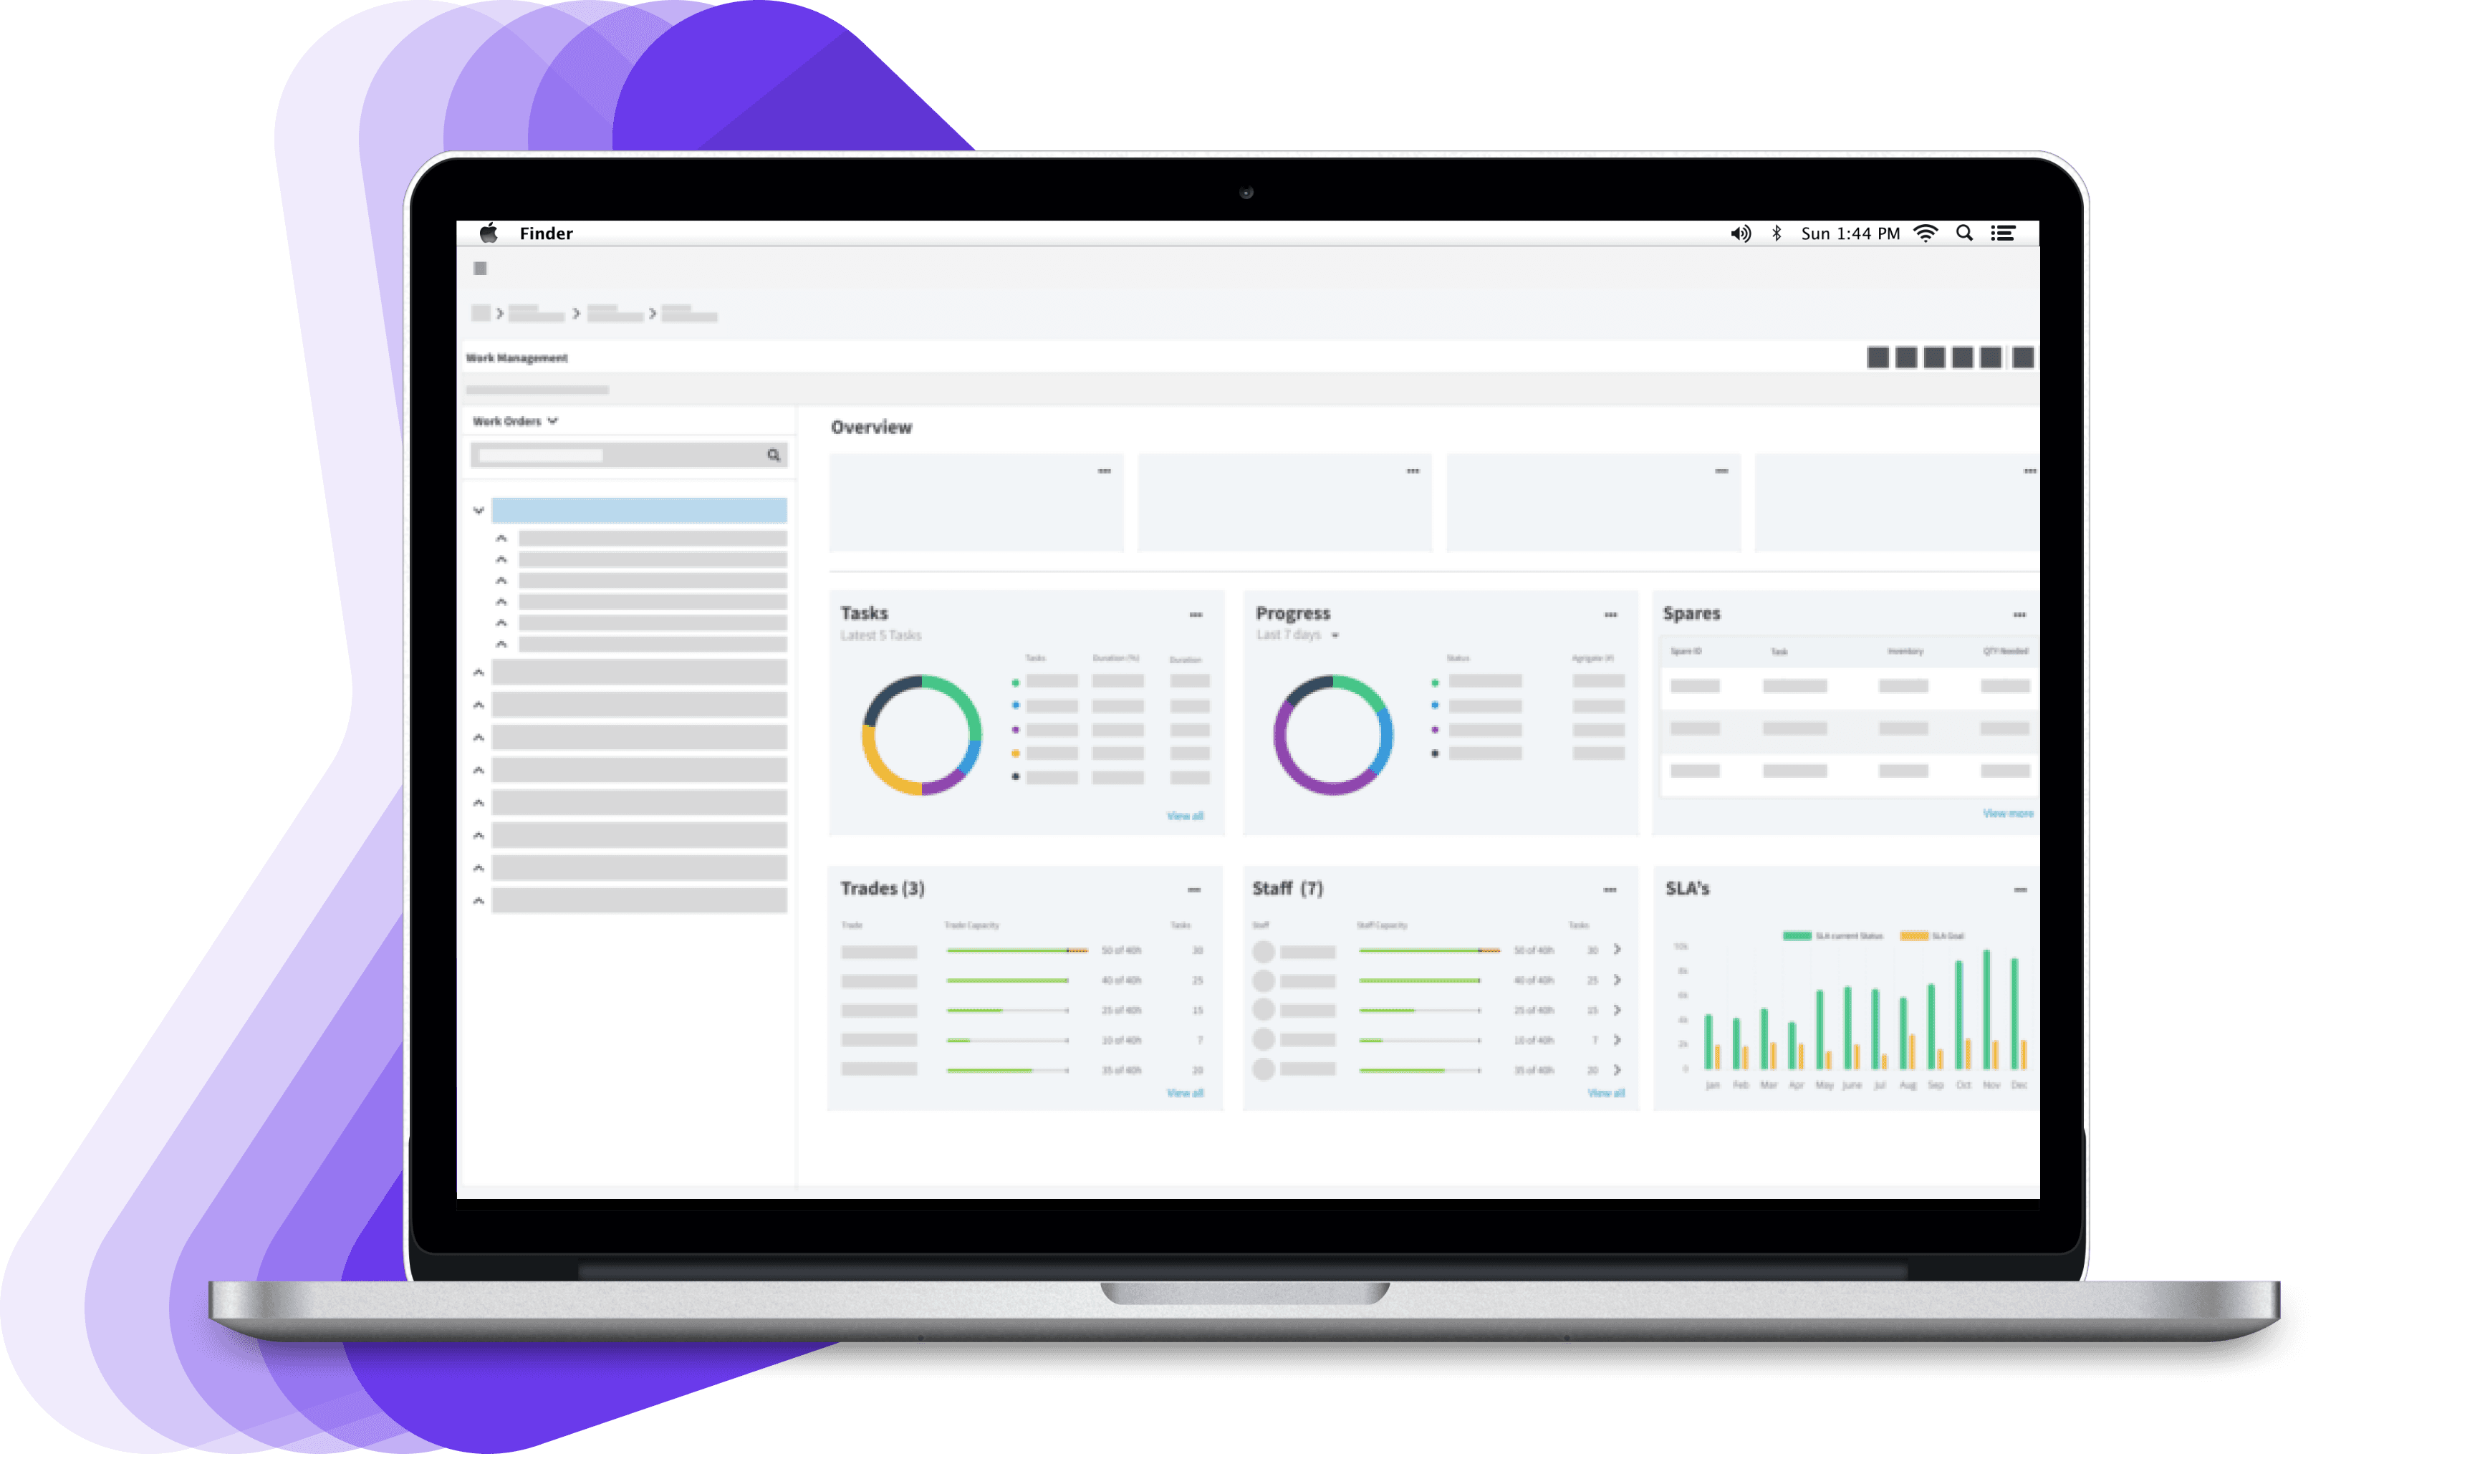
Dashboard Overview Wireframes
The dashboard displays the content and answers the above questions in a systematic and logical layout. Each section is separated and the core data displayed in order to show the required information at a glance. From the given data, the user can drill in further by clicking on the more button within each section.
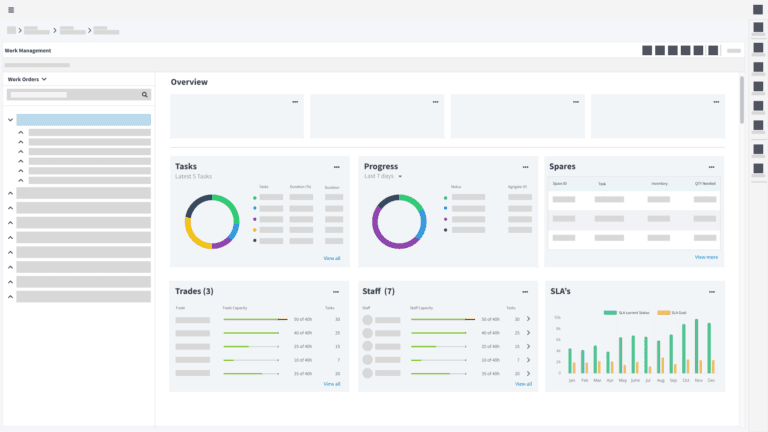
Dashboard Overview Wireframes
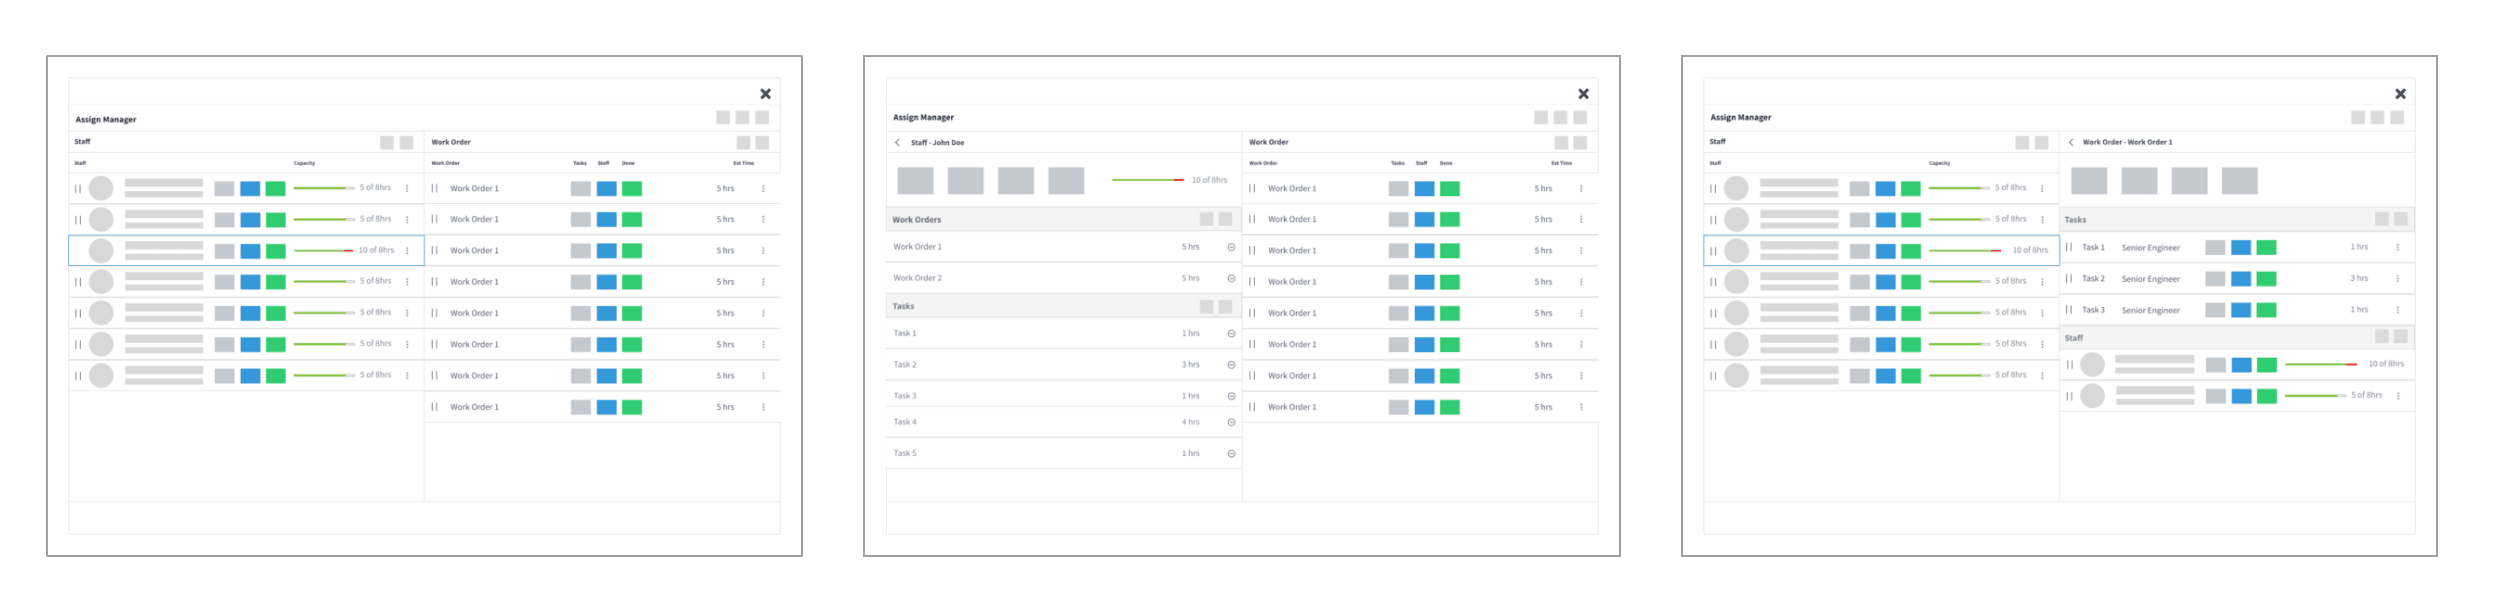
When it came to being able to assign and edit items and categories, the process needed to be easy to navigate and dynamic enough that the user could make changes between entities with as few clicks as possible.
I used a 'bucket' system, where the user could drag an item into another item to fill their capacity (as seen in the below example of tasks being added to a staff member). The user could also dive in further to see what makes up the capacity and add/remove items to and from the list if needed.
The system was made to be diverse so that an item could be added at any stage as well as the reverse, such as in the example a user could be dragged and added to a task within a work order if needed. This eliminates the need for the user setting up categories from scratch and gives them the ability to make changes from their current stage in the process.
Prototyping
Overall the dashboard allows the user to view important data at a glance as well as allow the user to dive deeper and edit content as needed, solving both scenarios.
View Prototype